Brief 2016 Real Estate Market Summary
2016 was a much talked about year when it came to Vancouver real estate. The first 6 months saw unprecedented sales prices in the single family house sector. Single family detached houses in both Vancouver East Side and Vancouver West Side were selling within just a few days of being listed and at selling prices much higher than the listed price. The average price of a Vancouver detached house was rising at an unsustainable pace. As we entered the month of June, buyers had become weary of the fast paced housing market and began to step back. We then saw the new Foreign Buyers Tax introduced without any proper notice and by the end of June the detached housing market had cooled and the downward pressure on prices had begun.
The condominium and townhouse market operated separately in comparison to the detached housing market in 2016. The overall activity was very good in 2016 with moderate price gains. We only witnessed a slight slowdown in activity from the end of July through August. By the end of September the activity picked back up and continued through to the end of 2016. Low interest rates, lack of supply and high rents fueled the condominium and townhouse market in 2016 and will continue to do so in the first quarter of 2017.
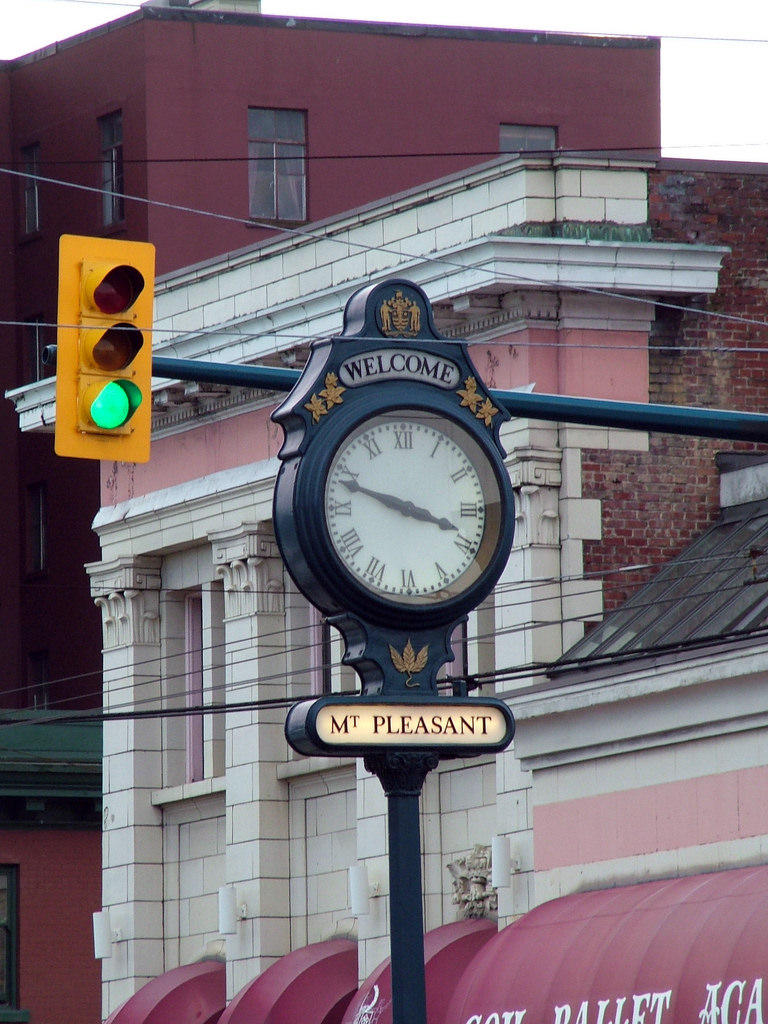
Mount Pleasant Detached Houses
The single family detached house real estate market in Mount Pleasant was very active in the first six months of 2016. From January to June we saw property values increase and listings receiving multiple offers within days of hitting the market and selling prices over asking. At the peak of activity in the month of May 2016, the average number of days for a single family detached house in Mount Pleasant on the market was 10 days and on average 4.7% above the asking price. As we entered the month of July, the activity slowed followed by moderate downward price corrections. Mount Pleasant continues to be very popular with young professionals and families and well maintained houses priced accurately are selling on average within 40 days of being listed and on average 5% below the asking price. In summary, as we enter the first quarter of 2017 we should see decent activity for single family houses in Mount Pleasant but pricing will be important. If a listing is overpriced it will sit on the market with little or no activity. Today’s buyers are sensitive to the downward pressure on property values and are price sensitive.
Number of Detached Listings and Sales for 2016 in Vancouver Mount Pleasant
| Month | Number of Listings | Number of Sales |
January | 8 | 1 |
February | 8 | 6 |
March | 6 | 8 |
April | 13 | 6 |
May | 15 | 6 |
June | 16 | 8 |
July | 13 | 5 |
August | 10 | 3 |
September | 16 | 0 |
October | 19 | 2 |
November | 13 | 7 |
December | 6 | 3 |
Total Sales | 143 | 55 |
The absorption rate for 2016 was 38 percent which indicates a seller’s market but this number is fueled by the early months of 2016 and if you are considering selling is 2017 a micro market analysis is needed.
Number of detached sales by price range in Vancouver Mount Pleasant
$0 - $1,000,000 | 1 |
$1,000,001 - $1,500,000 | 25 |
$1,500,001 - $2,000,000 | 28 |
$2,000,001 plus | 1 |
Total Sales | 55 |
The lowest priced sale in Mount Pleasant was $998,000
The highest price sale in Mount Pleasant was $2,270,000
Mount Pleasant Condominiums and Townhouses
 The condominium and townhouse market in Mount Pleasant was very active in 2016 with only a moderate slow down in August. Prices increased from the early months of 2016, plateaued around September and have not had any downward pressure as we ended the year of 2016. The entry level market was and continues to be extremely active. The current data and information points towards a healthy condo and townhouse market for Mount Pleasant in the first quarter of 2017. As long as interest rates and inventory remain low, we will see good activity up to $1,275,000. Pricing is important as buyers are still price sensitive because of the media and constant discussion of the possible downward correction of prices across all sectors of the Vancouver real estate market. The Mount Pleasant condominium and townhouse market is projected to remain a seller’s market in the first quarter of 2017.
Number of condominium and townhouse sales by price range in Vancouver Mount Pleasant
$0 - $500,000 | 224 |
$500,001 - $1,000,000 | 320 |
$1,000,001 - $1,500,000 | 66 |
$1,500,001 - $2,000,000 | 10 |
$2,000,001 plus | 2 |
Total Sales | 622 |
The lowest priced condominium sold in Mount Pleasant in 2016 was $160,000 and the highest priced condominium to sell was $2,175,000.
In Summary
The Mount Pleasant condominium and townhouse market in 2016 was one of the most active neighborhoods in Vancouver. There is no sign of this market slowing into the first quarter of 2017 but pricing and marketing strategy is important. The detached single family house in Mount Pleasant is moving at a slower pace in relation to the condo market. There continues to be downward pressure on pricing yet activity is good under 1.7 million dollars. Buyers looking to purchase a house are price sensitive and listings must be priced accurately or they will sit on the market.
For a detailed overview of the 2016 Vancouver real estate market please click here.
Please feel free to contact with any questions you may have at this time.
Written by Don Urquhart Vancouver real estate agent since 1987 and Mount Pleasant specialist
