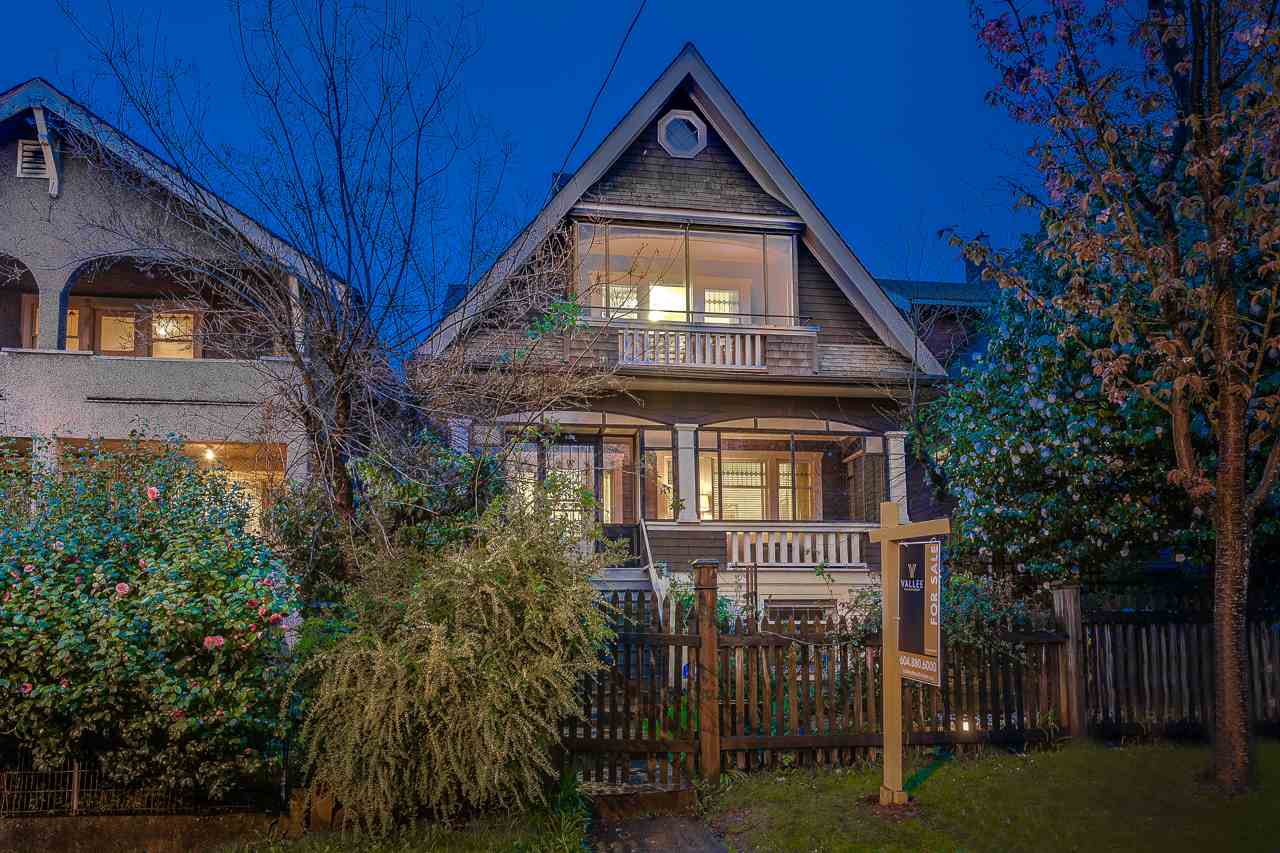
Pricing, property type and of course location, are key factors in determining where the most real estate activity is taking place. The latest data shows that the number of sales for Vancouver is down by 30% from March of 2017. The 30% decrease in volume has a loud ring of negativity, however, property sales in specific price ranges in good locations are selling on average within 30 days of being listed and are selling close to asking price.
Single detached house sales on the West Side are slow and are currently the under-performer of all housing sectors. Detached houses in sought after West Side neighbourhoods priced under $2.8 million are selling at close to asking.
The condominium market is busy; it is a different story all together. I don’t see this changing in the near future. Why? Affordability, low interest rates, lack of good listings for sale and a close to 0 percent vacancy rental market. The Vancouver condo market is a strong sellers’ market up to $1.7 million on the West Side and up to $800,000 on the Vancouver East Side. Even in this busy condo market accurate pricing is important; todays buyer is very aware of market value and changing market conditions. I have witnessed good properties that are overpriced sit on the market.
Vancouver Real Estate Market Review by Area and Type
Sales to Active Listing Ratio
- 0 – 14% Buyers Market
- 15% – 20% Balanced Market
- 21% plus Sellers Market
Vancouver Downtown (Downtown, West End, Yaletown, Coal Harbour)
The Downtown condominium market is busy with the sub area of West End being the best performer.
Sub Area Listings Sales Sales to Listing Ratio
West End 67 42 63%
Downtown 161 75 47%
Yaletown 127 50 39%
Coal Harbour 60 20 33%
This is mostly because the West End neighbourhood offers more affordable housing compared to Yaletown and Coal Harbour. The sales to active listing ratio in the price range of $300,000 to $1.7 million for all of Downtown sub areas was 62 percent which stipulates a very strong sellers’ market. The price range from $1.75 million to $2.75 million has a sales to active listings ratio of 20 percent which puts it right on the edge of a balanced market leaning to a sellers’ market. As soon as the price point reaches or exceeds $3 million, the activity drops off significantly with a sale to active listing ratio of less than 1 percent.
Vancouver West Side
The single detached house market is active up to $2.8 million with the average days on market at 31. The sales to active listing ratio from $1.25 million to $2.8 million is 17 percent placing it in a balanced market. Kitsilano saw the most activity over the past 30 days with Mackenzie Heights coming in as a close second. Once the price point reaches $4 million dollars plus the number of sales drops off significantly. There were a total of 411 detached houses listed over $4 million during the past 30 days with only 8 sales. This means the sales to active listing ratio for this price range is .02 percent placing this price category in a buyers’ market.
The West Side condominium market as previously stated is operating at a busier pace and is a sellers’ market up to $1.7 million. In fact, the price range from $400,000 to $800,000 has a 100 percent sales to active listing ratio. The upper price range from $2 million to $5 million dollars plus is a balance market with a 15 percent sales to active listing ratio.
Vancouver East Side
The single detached house market on the East Side of Vancouver has a sale to active listing ratio of 13 percent which indicates a buyers’ market. The 13 percent does not accurately reflect what is happening $1 million to $1.7 million dollar price range. If you look at the past 30 days of sales for the price range of $1 million to $1.7 million it shows a sales to active listing ratio of 28 percent which indicates a sellers’ market. Buyers currently shopping for a detached house in the Main, Mount Pleasant, Grandview and Fraser sub areas under $1.7 million are often having to compete in multiple offers. Once you reach 2.25 million dollars plus the market slows down. There are presently 223 detached houses listed over $2.25 million and there have only been 6 sales in the past 30 days. This places the $2.25 million plus price range at a .02 percent sales to active listing ratio.
The East Side condominium market is a sellers’ market with a sales to active listing ratio of 75 percent. The two most active neighbourhoods for sales in the past 30 days were Downtown East and Hastings East.
In summary, there is lack of confidence in the West Side single detached house market; buyers are very cautious and are able to shop for good opportunities. Pricing and marketing must be accurate and professional to attract todays buyers. The East Side single detached market is active up to $1.7 million dollars but the properties must be accurately priced and with a lower level mortgage helper. The condominium market shows no signs of slowing in the near future. If banks keep their lending rules as is and inventory remains low we should see a sellers’ market continue through the Spring and Summer months of 2018.
If you would like a more detailed outline of property type and location please send me an email or give me a call. I am always happy to hear from you.
Direct number 604 787 1210
Email [email protected]
Written by Don Urquhart – Vancouver Real Estate Since 1987
