In my last September newsletter, I wrote that the condominium and townhouse market had finally joined the detached market and officially shifted from a seller’s market to a buyer’s market (with the exception of the lower price range for condos). Today, there is downward pressure on pricing on condominiums, townhouses and single family detached houses. This downward pressure has created buyer uncertainty and in turn has slowed the market considerably from the North Shore to the Fraser Valley. This has given way to listing inventory increasing by 42% in October 2018 compared to that of October 2017 and monthly sales volume off 38% compared to October 2017. Prices have edged off by approximately 3% to 5% percent over the past 60 to 90 days.
Four factors placing downward pressure on prices:
- Increased real estate taxes for today’s buyers both resident and foreign
- Stricter lending rules from major banks
- Buyer uncertainty
- Increasing listing inventory (supply vs demand)
Listing inventory has increased month over month from June of this Summer because many sellers are hanging on to yesterdays peak sale prices and are not reducing to align themselves with the current market. These properties are sitting on the market and buyers are not interested in viewing or making offers when they can view other listings that are priced less and at todays current market values. Because of buyer uncertainty, buyers are also in no hurry to purchase and they will overlook any property that may need repairs or immediate cash input in the near future. Sellers today need to bring their property to the market professionally, well presented and accurately priced to achieve good offers. I recently listed and sold a condominium in one of Vancouver’s more popular towers downtown and I assisted the homeowner in getting the property ready for the market over a two week period. The listing was competing with many other condos for sale on MLS in the neighbourhood but we received 4 offers of which two were very good and this resulted in a very successful sale for my seller. There is decent activity in the sub 1-million-dollar price range but there is zero room for error to receive good offers.
As previously discussed, there is downward pressure on prices across all types of properties especially for the upper price categories.
Let’s look at where the activity is today by property type, location and price.
0 – 14% Buyers Market 15% – 20% Balanced Market 21% plus Sellers Market
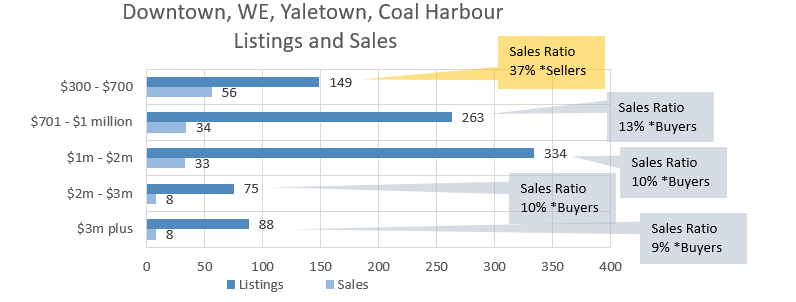
The activity for condominiums in the West End, Yaletown, Coal Harbour and Downtown neighbourhood drops off significantly as soon as the price point moves above $700,000. If the Bank of Canada does another rate hike in the coming weeks it will be interesting to see how the sub $700,000 price category will fare.
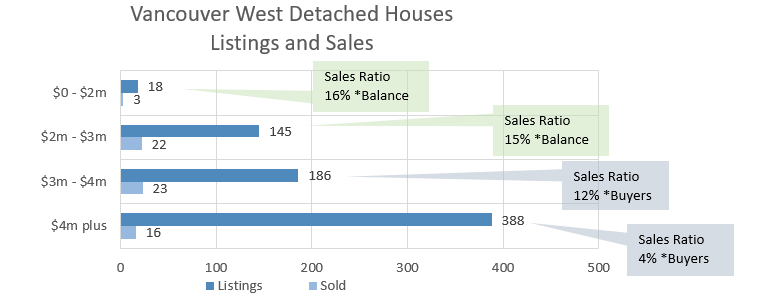
The Vancouver West Side detached house sales remain slow and there are no signs of the activity picking up in the near future. The $1.5 million to $3 million dollar price range is barely in the balanced market category and for all intensive purposes this price range is a Buyers market even though the October stats state otherwise in the above chart.
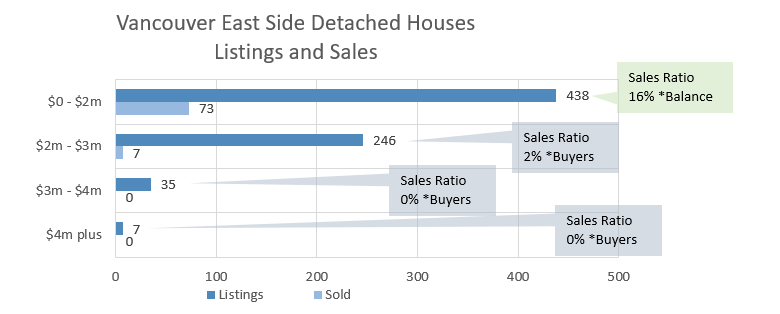
It does not seem that long ago when I wrote a few articles on the very active Vancouver East Side detached housing market in the $2,000,000 to $3,000,000 dollar price category. There were a total of 95 detached houses sold on the East Side from May to July in 2016 with sale prices from $2.2 million to $3 million. There are currently 246 active listings in this price range and there were only 7 sales for the month of October. This is a clear statistic that verifies the downward pressure on property values for East Side detached houses.
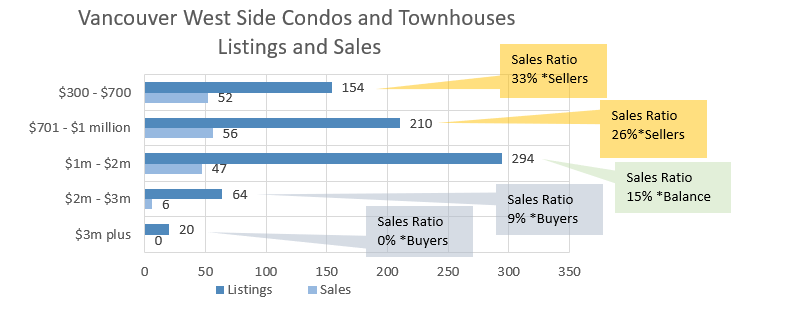
The Vancouver West Side condominium and townhouse market is active up to the $1 million price point but the activity slows significantly as soon the prices increase above $1.5 million.
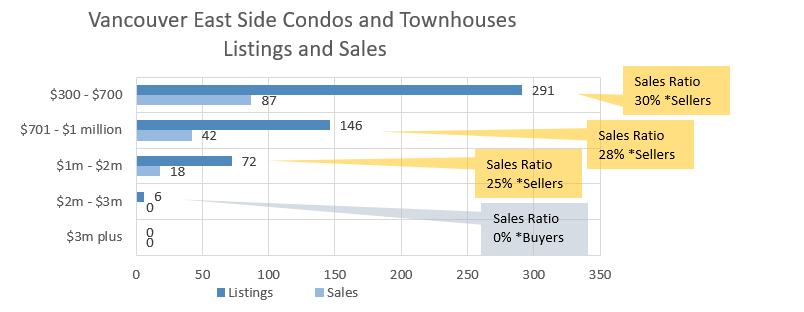
The Vancouver East Side condominium and townhouse chart states a seller’s market up to the $2 million price point. The $1 million to $2 million price range is primarily driven by the half duplex sales. There continues to be a demand for half duplex’s in Mount Pleasant and Commercial Drive and a continued lack of supply for this style of housing.
If you have specific questions about the current market or about a specific property, please contact me. I am always happy to hear from you.
Written by Don Urquhart – Vancouver Real Estate Agent for 20 plus years.
Meet Don Testimonials Featured Listings Don’s Fundraising Don’s Solds